Posted on September 6, 2017
By Callie Clark and Tom Hopper
Co-directors, MHP Center for Housing Data
Metro Boston is NOT winning the home-building race. Not even close. In fact, we might be on the sidelines, handing out water to the metros that are passing us by.
But that’s not the message from Trulia’s recently published a blog article titled “Who Will Win the Homebuilding Race of 2017?,” which looks at which metros are increasing their housing stock at high and low paces. The analysis uses data from the U.S. Census Bureau’s Buildiung Permit Survey, which allows for an easy comparison across metros. Trulia has done an admirable job creating intuitive graphics and interesting analysis.
However, as a Massachusetts-based, housing-focused data team, our staff at MHP’s Center for Housing Data was surprised to find that Metro Boston ranked #5 on a list of “Metros Building More than their Historical Average.” In fact, we even received a few emails from partners and other contacts who had seen the Trulia piece, asking us how it is possible that Metro Boston could be highlighted for strong housing development, when we know that developing any kind of housing in Massachusetts can be a struggle. What’s going on here?
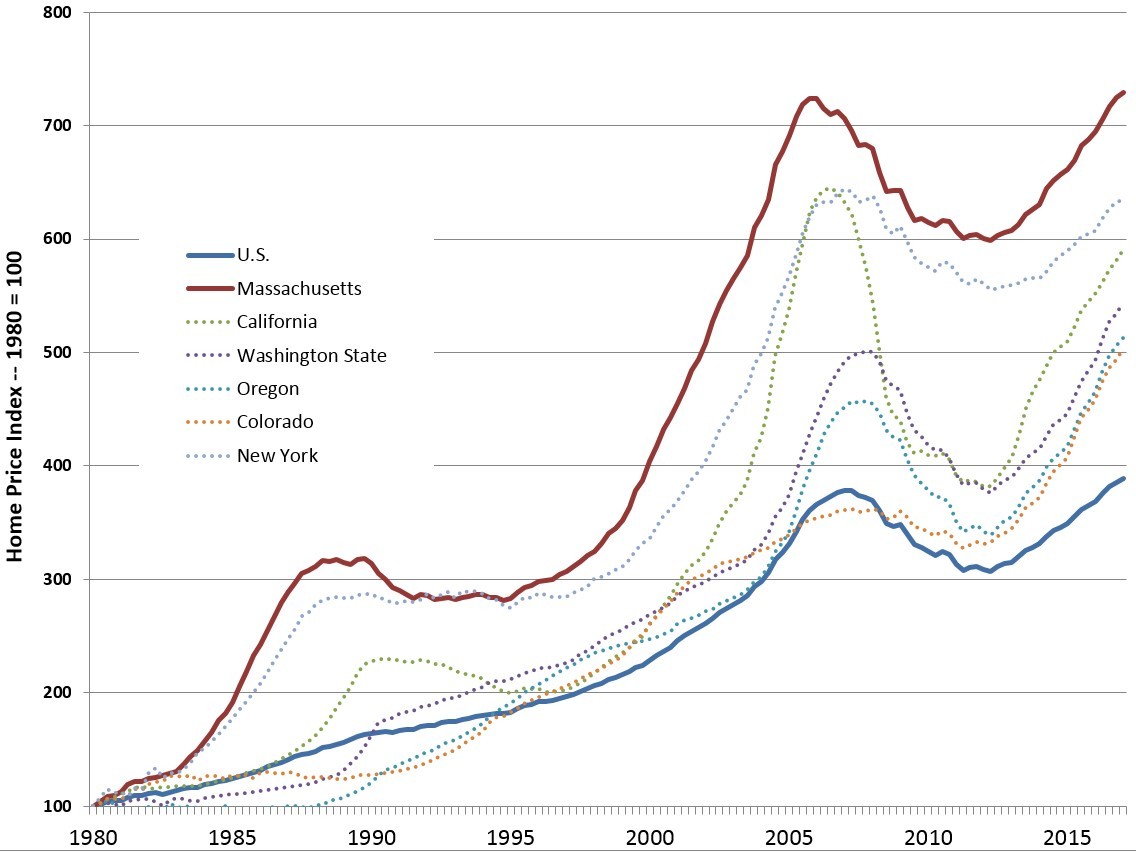
Although the Boston MSA is currently permitting more new units than it did on average from 1980-2016, it is still permitting at very low levels for a metro region its size. We weren’t producing enough new housing back then, and we are not producing enough new housing now. In fact, 1980 was the year in which housing prices in Massachusetts began deviating dramatically from national levels, in large part due to our restrictive zoning practices and associated low production numbers. Our home prices have increased faster than any other state, including California and New York.

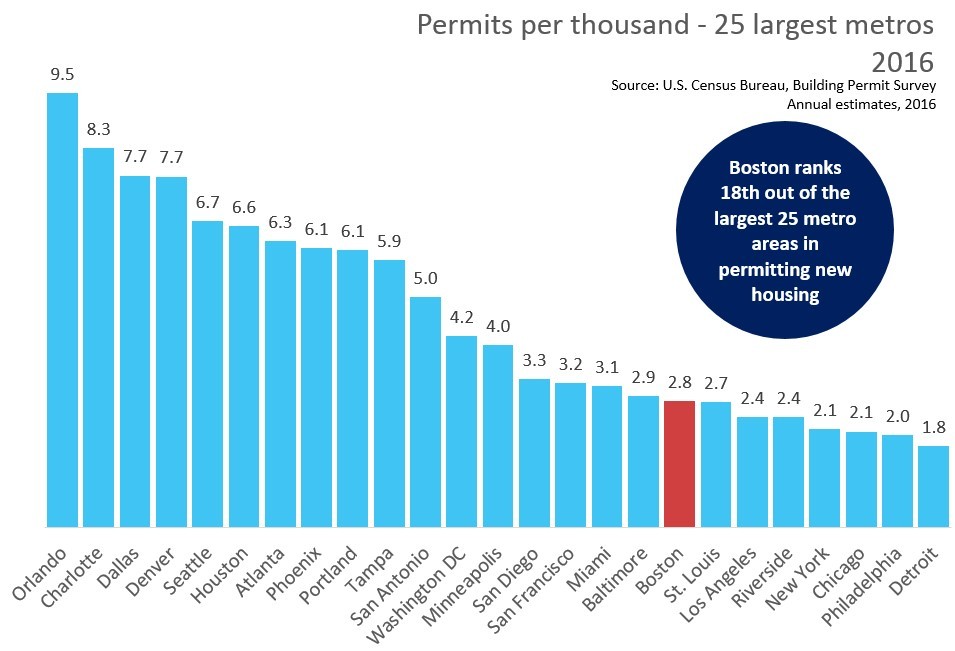
So, perhaps applauding Metro Boston for barely surpassing a decades-long slump in housing production is a little overzealous. There are better ways to compare metros when it comes to housing production. Trulia does provide some rankings on raw permitting numbers, which places Metro Boston much, much further down the list. We regularly work with the same dataset, and we like to normalize housing permits by population in order to make direct comparisons between metros.
When you compare metros on this normalized metric, Boston's metropolitan area does not perform so well. Out of all metros in the country, we rank 213th out of 384. Out of just the 25 largest metros, we are 18th. Ahead of us are a number of metros that are rapidly growing, and are magnets for talented workers, such as Seattle and Denver.

A growing economy needs a growing labor force, and a metro can’t increase its labor force without having a place for incoming workers to live. With other metros more aggressively working to accommodate new residents, can Metro Boston’s stagnant housing growth and surging prices continue to compete?
MHP’s Center for Housing Data will be hitting on this topic frequently over the coming year, so stay tuned!
